It’s all the hype these days and one of the latest trends in digital marketing. Yep, we’re talking about influencer marketing.
Compared to social media marketing or even video marketing, influencer marketing is considered to be a fairly new branch of marketing. Influencer marketing statistics show that an increasing number of businesses are also beginning to invest heavily in it.
If your business is one of them, there’s lots you need to comprehend to perfectly implement and execute your influencer marketing strategy. Aside from understanding the basics like what’s an influencer, what influencer marketing is, and the ideal influencer marketing spend, you’ll need to arm yourself with more concrete influencer marketing statistics and facts.
And that’s what we’re here for. In this article, we bring you the ten most important influencer marketing statistics you need to know. By the way, to learn more about how to master an Instagram for your brand, sign up for the Instagram course.
Post Contents
- 1. Influencer Marketing Usage Among Marketers
- 2. Influencer Marketing Effectiveness
- 3. Influencer Marketing ROI
- 4. Influencer Marketing Industry Growth
- 5. Most Important Influencer Marketing Channels
- 6. Influencer Marketing Budget
- 7. Top Influencer Marketing Goals
- 8. Effect of Influencer Marketing on Consumers
- 9. How Many Instagram Influencers Are There?
- 10. Leading Topic for Branded Partnerships on Instagram
- Conclusion
- Summary: Influencer Marketing Statistics
- Want to Learn More?
1. Influencer Marketing Usage Among Marketers

To start us off, here’s an influencer marketing statistic that shows just how popular it currently is—more than nine out of ten marketers today have influencer marketing as part of their overall marketing strategy (SocialPubli, 2019).
Plus, more than half use influencer marketing on a regular basis. One-quarter of them use it “frequently,” while nearly one-third have it as an ongoing strategy.
Given that influencer marketing is still in a relatively adolescent phase, its usage and growth are fairly impressive. Fewer than one-third (27.9%) of marketers have been using influencer marketing for over three years, 20.9% have only been using it for less than a year, and just a handful (7%) have never used it.
But its growing popularity among marketers today is perhaps a sign of its effectiveness, which brings us to our next point.
2. Influencer Marketing Effectiveness

Nearly all marketers—90% to be exact—believe influencer marketing to be an effective form of marketing (Influencer Marketing Hub, 2021).
This is so much so that three-quarters of marketers say they will be allocating a dedicated budget for their influencer marketing activities, and up to 62% even plan on increasing their expenditure.
Other influencer marketing statistics certainly back this belief. Just under seven out of ten US marketers working in companies with at least 100 employees plan to use influencer marketing. Not just that—influencer and paid content are expected to make up 20% of digital marketers’ and agencies’ ad budgets.
3. Influencer Marketing ROI

Here’s one of the most powerful influencer marketing statistics to convince you of its effectiveness: Businesses that use influencer marketing for publicity earn $18 for every dollar invested (Influencer Marketing Hub, 2018).
In other words, every dollar a company spends on influencer marketing generates $18 in publicity value. These returns fall in the higher end of the spectrum, but even a look at returns across the board will show relatively high average returns of $5.20.
In fact, the majority of marketers believe that influencer marketing offers the highest Return on Investment (ROI), even more so than the more traditional marketing tools such as SEO, email marketing, social ads, and SEM.
That said, determining the ROI of influencer marketing appears to be one of the most challenging aspects marketers face. While some focus on view, reach, and impression, others prefer to measure metrics such as engagement and clicks. Ultimately, it all depends on each business’ objectives.
4. Influencer Marketing Industry Growth

With such a high ROI, it’s no wonder the influencer marketing industry has seen tremendous growth in recent years.
Current social media usage worldwide is showing no signs of slowing as it permeates all aspects of consumers’ daily lives. As a result, analysts are expecting influencers to take on increasingly important roles as intermediaries between brands and consumers. This means that brands will need to step up their influencer marketing efforts to better connect with consumers.
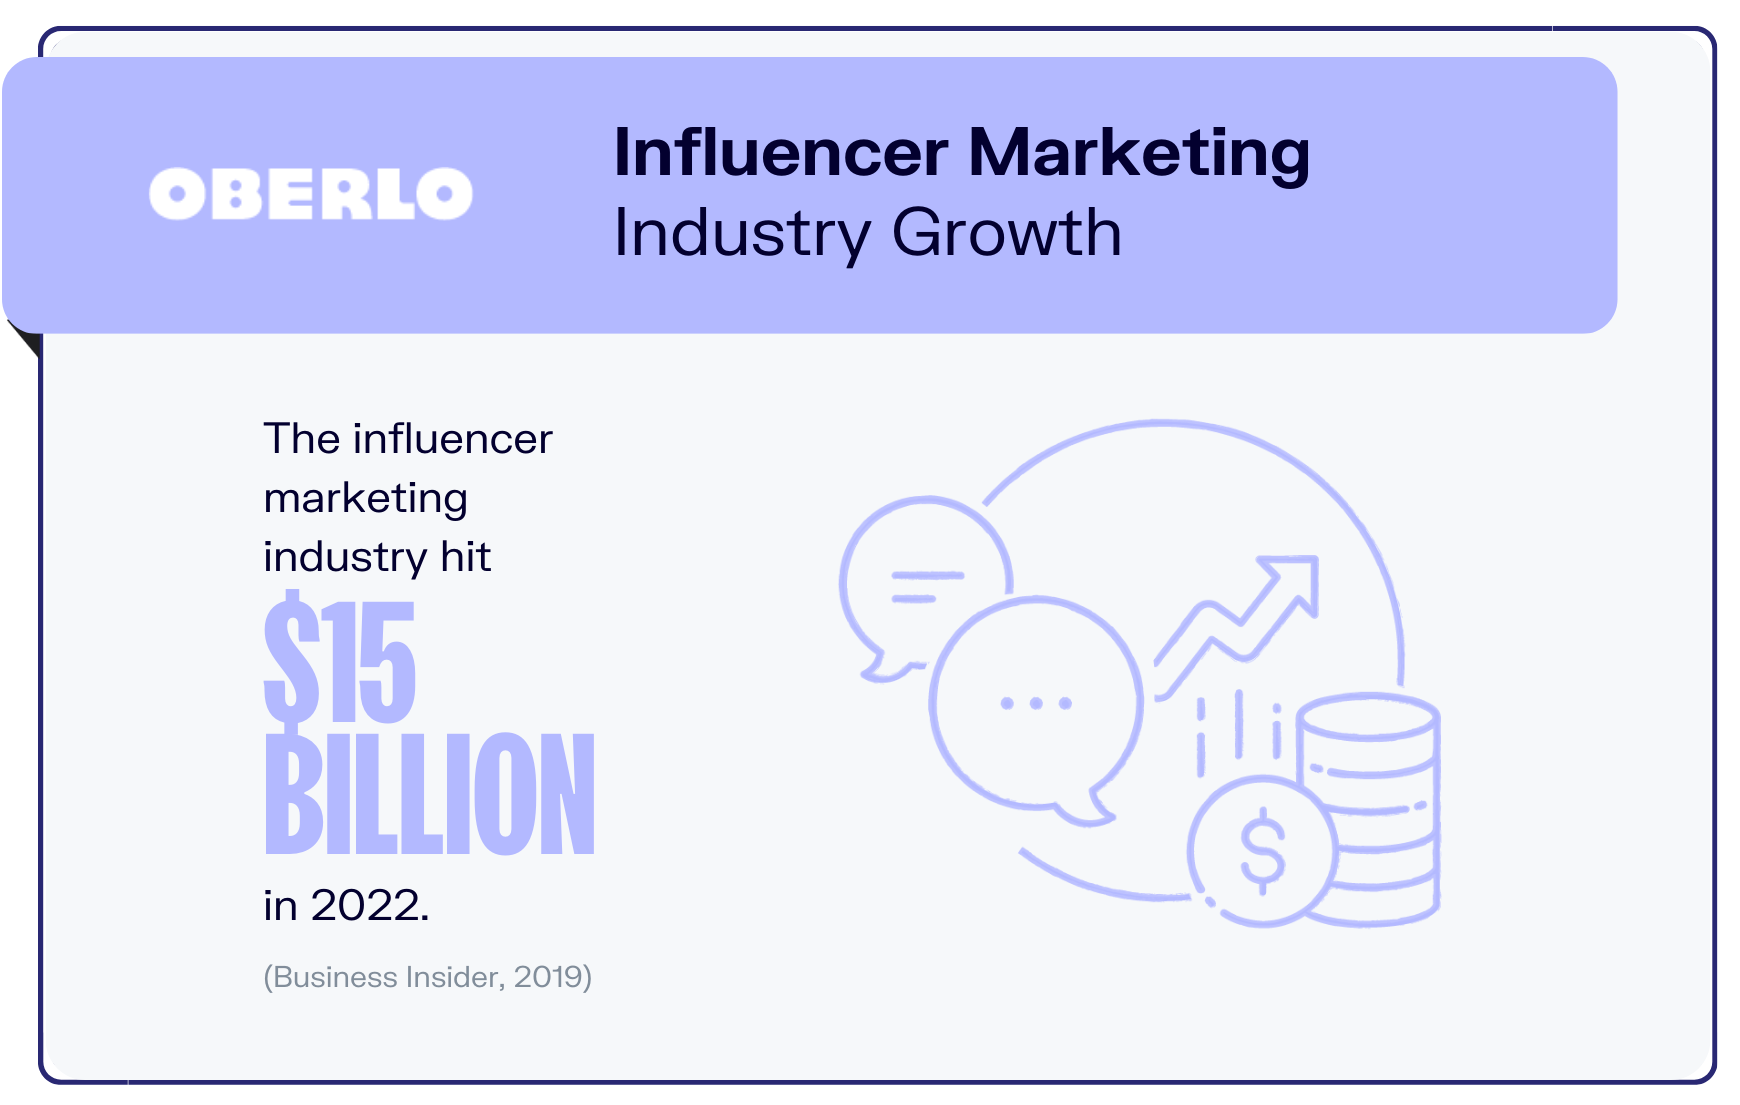
The latest figures certainly support this. Data shows that in 2020, brands spent up to $15 billion on influencer marketing (Business Insider, 2019). Considering that brands’ total influencer marketing expenditure in 2019 was $8 billion, that means that the influencer marketing industry increased by 87.5% in as little as three years.
Such massive growth is only proof of its potential. So if you’re still considering whether you should use influencer marketing to boost your brand, it’s best to get right to it.
5. Most Important Influencer Marketing Channels

With so many social media sites available for you to choose from to start your influencer marketing strategy, where should you begin?
Fret not. Here are some market figures to guide you.
Instagram is by far the most popular influencer marketing platform among brands. As many as 76.7% of marketers and agency professionals say they will be using Instagram as part of their influencer marketing strategy in 2023 (eMarketer, 2022). This is followed by Facebook, the “king of social media,” which nearly three in five (58%) marketers plan to use.
TikTok is the third most popular channel, with 50%. This marks a massive jump from 2019, during which just a meager 27% of marketers used TikTok for influencer marketing. Popular video-sharing platform YouTube and Twitter round up the top five platforms marketers use for influencer marketing, with 44.2% and 25.5%, respectively.
The platform you ultimately choose to do influencer marketing on will also depend on where your target audience is. If the majority of your audience uses YouTube the most, engaging with an Instagram influencer to promote your product probably wouldn’t be as effective.
6. Influencer Marketing Budget

The above-mentioned influencer marketing statistics evidence the rise of influencer marketing and its success.
But if you need further convincing of just how it’s becoming part and parcel of marketing strategies, here’s another statistic: 71% of marketers say they are going to increase their influencer marketing budgets (Linqia, 2021).
In fact, as many as 11% of marketers say they plan to spend at least 40% of their total marketing budget on influencer marketing. Most marketers (38%) intend to spend between 10% and 20%.
A company’s influencer marketing budget and spend also vary according to its size. That said, there’s a big variation when it comes to actual expenditure. The majority of brands (49%) spend under $10,000 a year on influencer marketing, while 8.6% spend over half a million dollars.
7. Top Influencer Marketing Goals

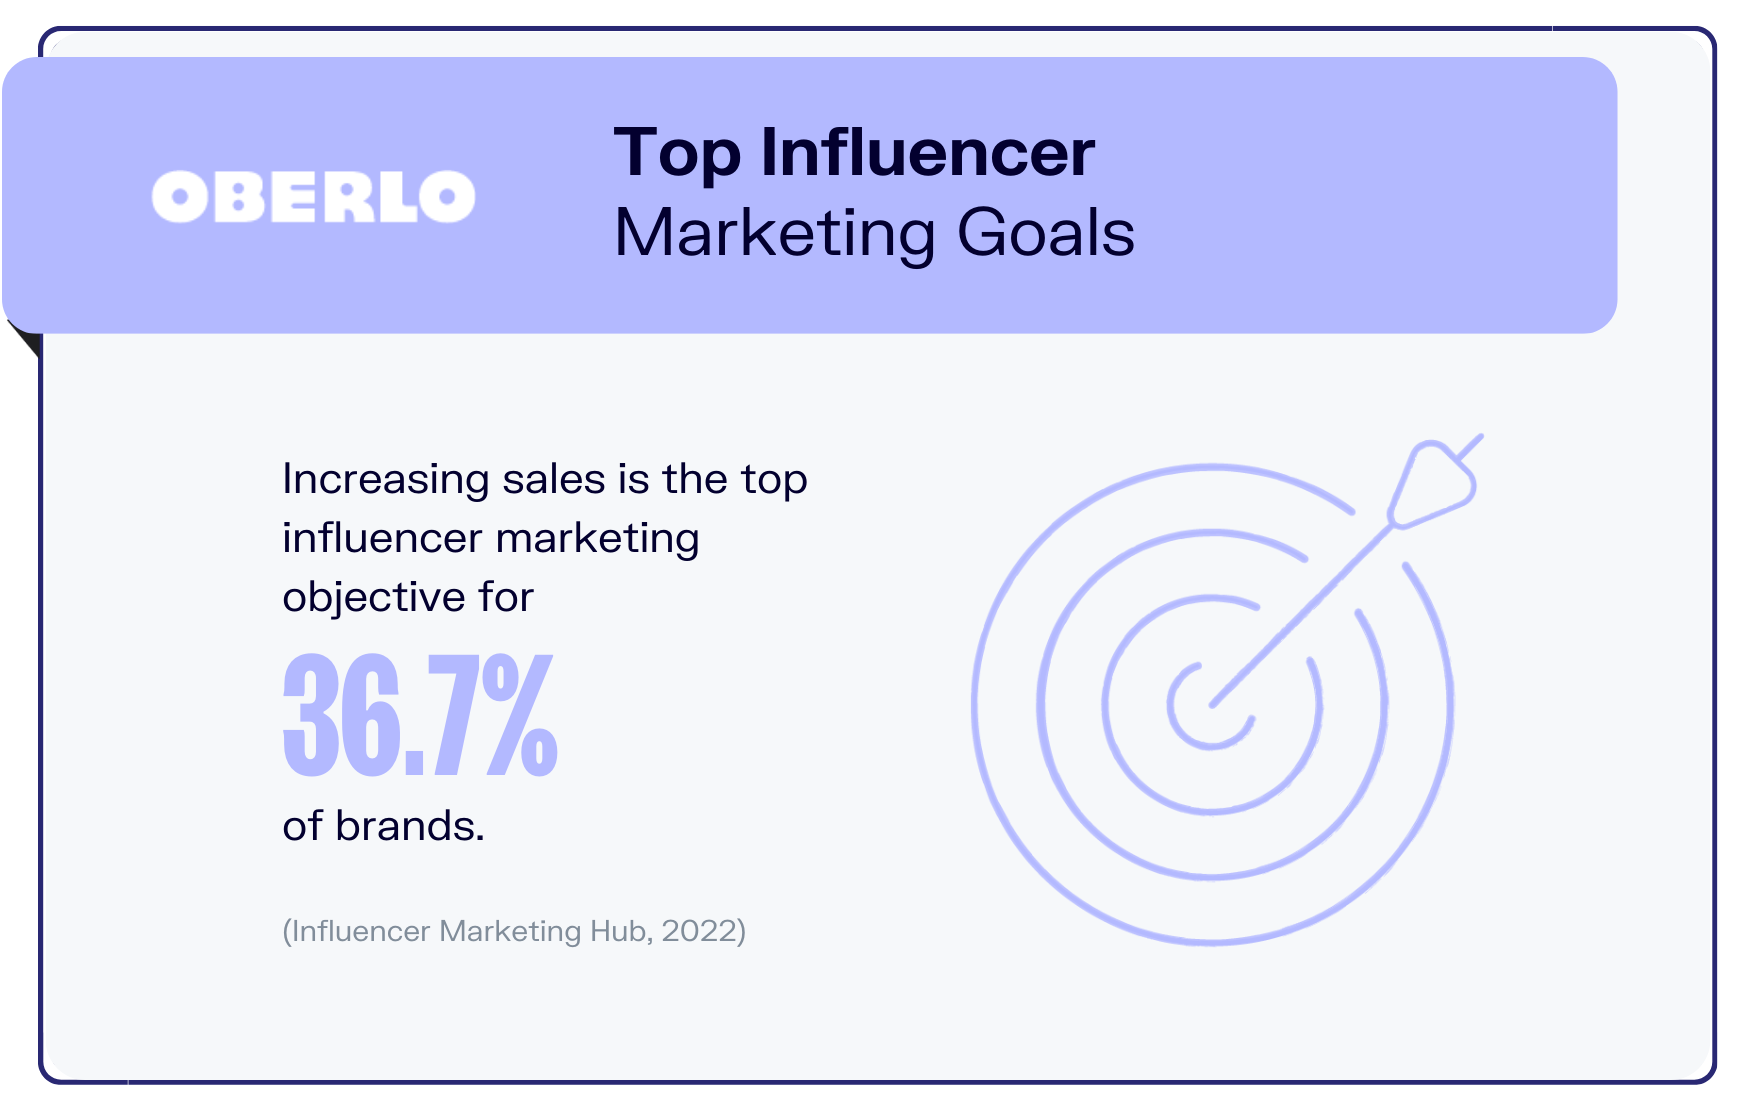
36.7% of marketers place raising increasing sales as one of their main objectives when running influencer marketing campaigns (Influencer Marketing Hub, 2022). This is followed by brand awareness (35.7%) and boosting user-generated content (27.6%).
With these influencer marketing statistics, it appears that the purpose of most influencer marketing campaigns is either related to growing brand revenue or brand image.
It’s no wonder then that when it comes to evaluating influencers, views, reaches, and impressions, as well as sales generated are among the most important metrics brands use. 21% of businesses use views, reaches, and impressions to access an influencer’s effectiveness, and 11% use sales to do so.
8. Effect of Influencer Marketing on Consumers

As we’ve seen, generating sales is the main goal of marketers carrying out influencer marketing campaigns. But just how effective are influencers in driving sales?
The latest influencer marketing statistics show that more than half (56%) of consumers say they have purchased something after seeing an influencer use it (IZEA Insights, 2022).
A closer look at the purchasing habits between men and women shows that more women than men are swayed by influencer marketing. Nearly half (49.2%) say they’ve purchased an item after seeing an influencer use it, compared to 43% of men.
A consumer's age also plays a role in how effective influencer marketing campaigns are on sales. While more than half of shoppers aged between 18 to 44 say they’ve purchased a product they’ve seen used by an influencer, just 39% of those between 45 and 60 have done so. This number falls to 33.2% for consumers aged above 60.
9. How Many Instagram Influencers Are There?

Not only is Instagram marketers’ favorite influencer marketing channel, but it is also the platform on which most influencers are active. You’re probably wondering: how many Instagram influencers are there?
The answer: There are half a million influencers whose preferred and only channel of influence is Instagram (InfluencerDB, 2019). Of them, the majority (81%) have between 15,000 and 100,000 followers, 15% have between 100,000 and half a million followers, while just 4% have more than half a million followers.
If you’re thinking the more followers the merrier, think again—studies show a negative correlation between the number of followers and engagement rates. That said, most marketers prefer to work with influencers with a less extravagant follower base (also commonly known as micro-influencers), typically between 10,000 and 100,000.
10. Leading Topic for Branded Partnerships on Instagram

With these Instagram influencer marketing statistics, you may now be seriously considering starting an Instagram influencer marketing strategy for your ecommerce business.
Before you start looking for influencers, you should consider your target audience and evaluate whether Instagram may be the most appropriate channel for your business.
Here’s something to get you thinking. Fashion is the most active sector on Instagram, with 25% of all sponsored posts on Instagram centering around it (InfluencerDB, 2019). This puts it way ahead of food (12%), entertainment (11%), and baby products (10%).
On the other end of the spectrum, there’s automotive (2%), decor (2%), and technology (1%).
Conclusion
Now that you’re armed with these ten influencer marketing statistics, you’re one step closer to launching your first influencer marketing campaign. Just remember to keep these influencer marketing statistics in mind while you plan out your campaign and manage your goals.
We’ve touched on Instagram as an influencer marketing platform in this post, mainly because it’s the most popular one. But there are plenty of other platforms you can use, especially if Instagram is not quite where your target audience is. For example, you may want to check out our guide to working with Facebook influencers and YouTube influencers.

Summary: Influencer Marketing Statistics 2023
Here’s a summary of the Influencer marketing statistics you need to know in 2023:
- 93% of marketers use influencer marketing as part of their marketing strategy.
- Nine out of ten marketers believe influencer marketing to be an effective form of marketing.
- Businesses that use influencer marketing for brand promotion earn $18 for every dollar invested.
- The influencer marketing industry hit $15 billion in 2022.
- Instagram is the most popular influencer marketing platform in 2023, used by 76.7% of marketers.
- 71% of marketers say they will be increasing their influencer marketing budgets.
- Increasing sales is the top influencer marketing objective for 36.7% of brands.
- 56% of consumers say they have purchased a product after seeing an influencer use it.
- Half a million influencers use Instagram as their preferred and only channel of influence.
- 25% of all sponsored posts on Instagram are fashion-related.
Want to Learn More?
- WooCommerce vs. Shopify: Which Is the Better?
- Instagram Stories: The Ultimate Beginners Guide
- How to Start a Business Online (From Scratch)
- How to Make Money on Instagram
Is there anything else you’d like to know about Influencer marketing statistics and wish was included in this article?
